

Momentum Trading Strategy for S&P 500
Overview
This project presents a momentum-based trading strategy for portfolio management, utilizing daily data from the S&P 500. It selects the top 50 stocks daily based on High Quality Momentum (HQM) scores, which are calculated using returns across multiple timeframes (one year, six months, three months, and one month). The strategy incorporates daily portfolio rebalancing to maintain exposure to the highest-momentum stocks. Performance is evaluated by comparing cumulative returns against the S&P 500 benchmark, visualized through a time series plot.
Here is the link to the code.
Data
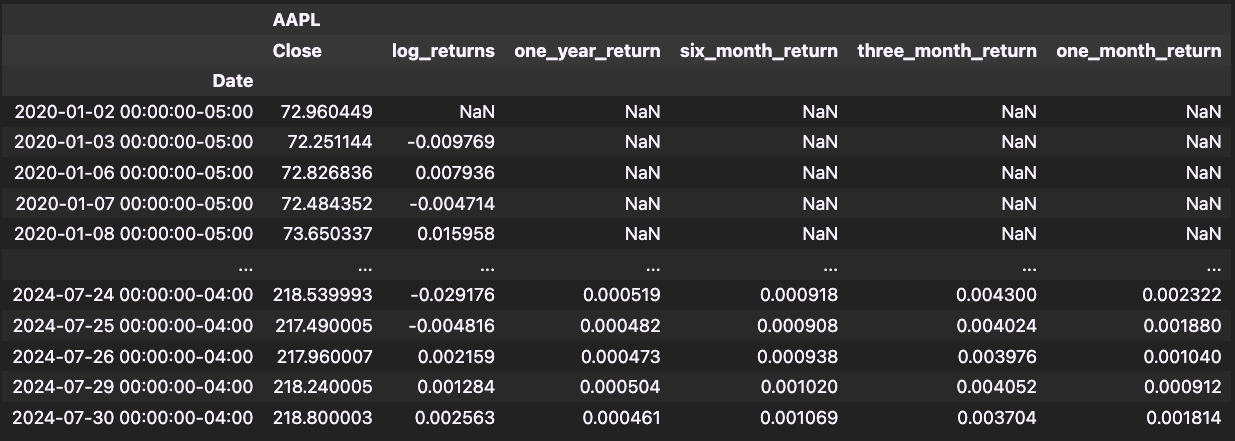
We first being by calculating the returns for the time periods for each stock.
High Quality Momentum (HQM) score
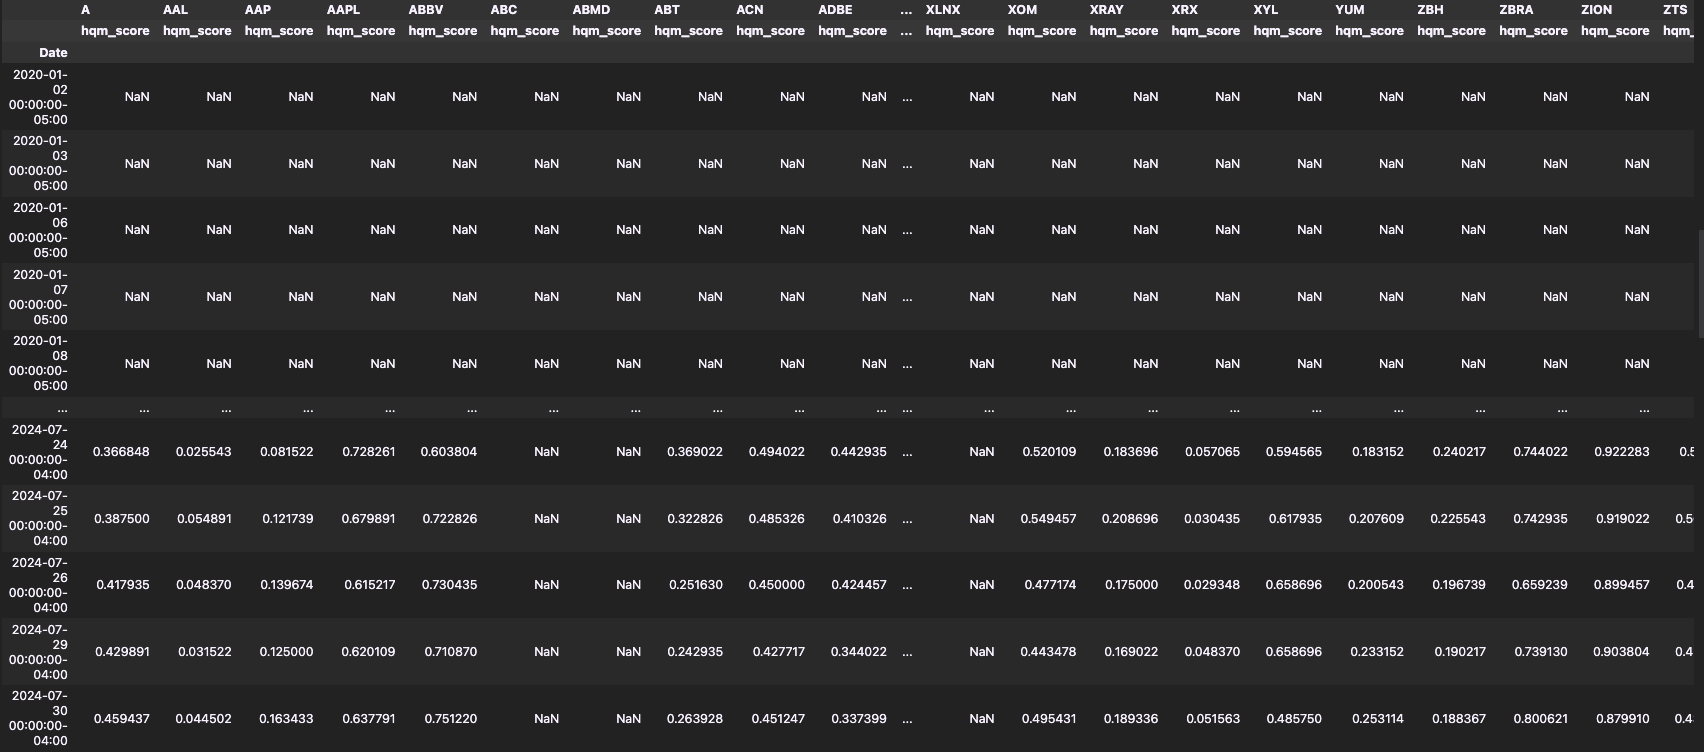
We use these returns to calculate percentile ranks for each timeframe, and the average of these percentiles is computed to derive the High Quality Momentum (HQM) score. The HQM score is a composite measure that identifies stocks exhibiting strong momentum across different periods, making it a crucial metric for portfolio construction.
Portfolio Construction and Returns
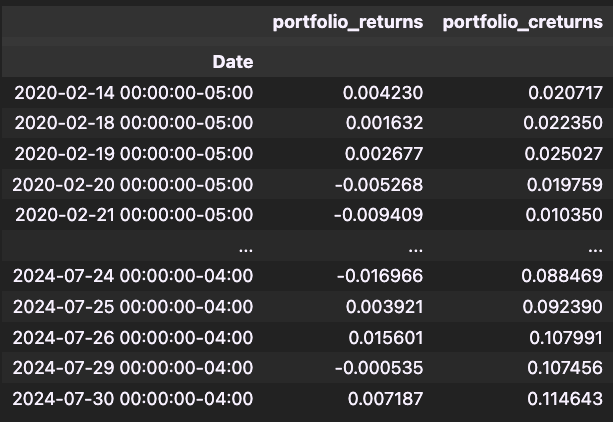
An equal-weighted portfolio is constructed using the top 50 stocks based on their HQM scores.
Performance Visualization
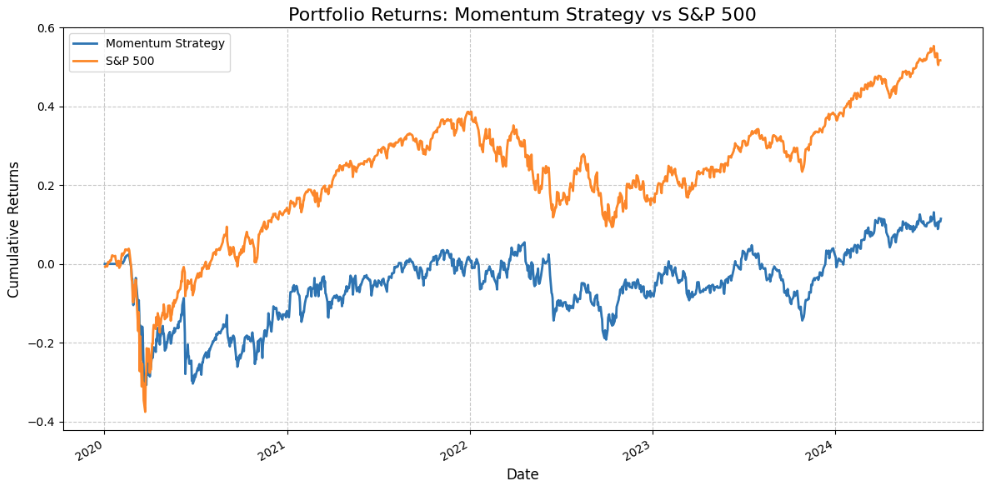
The strategy's performance is illustrated through a comparative chart that contrasts the momentum-based portfolio with the S&P 500 index. Although the strategy underperforms the S&P 500 benchmark, it serves as a proof of concept demonstrating the potential of multi-timeframe momentum in portfolio construction.
Key Skills
Python, Data Handling with pandas, Algorithmic Trading Strategy Development, Data Visualization, Performance Analysis, Risk Management, Financial Data Analysis, Technical Analysis